How to use Excel Analysis ToolPak and How to Activate
SHARE
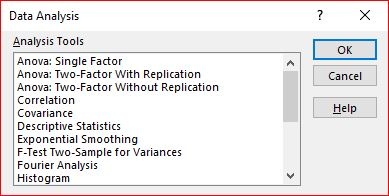
Analysis ToolPak is a very powerful Microsoft Excel add-in which has a pack of tools you can use to do data analysis tasks such as ANOVA test, descriptive statistics, generating histograms and regression analysis. Total of nineteen analysis tool are there in this add-in that comes with the latest Microsoft Excel version which Excel 2019.

So where is this data analysis toolpak in Excel ?
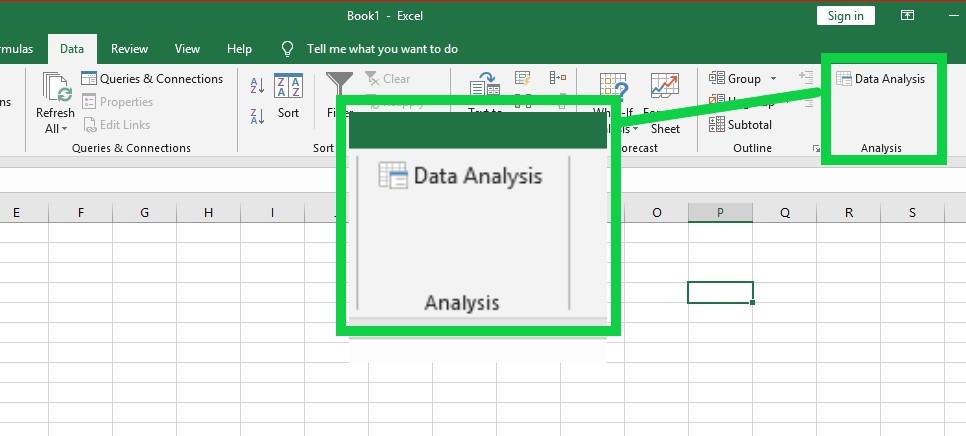
The command button to launch Analysis Tool-Pak generally located under “Data” tab in the ribbon. If you could not find it there, you will have to activate it.

How to activate Analysis Toolpak in Excel ?
Step 01
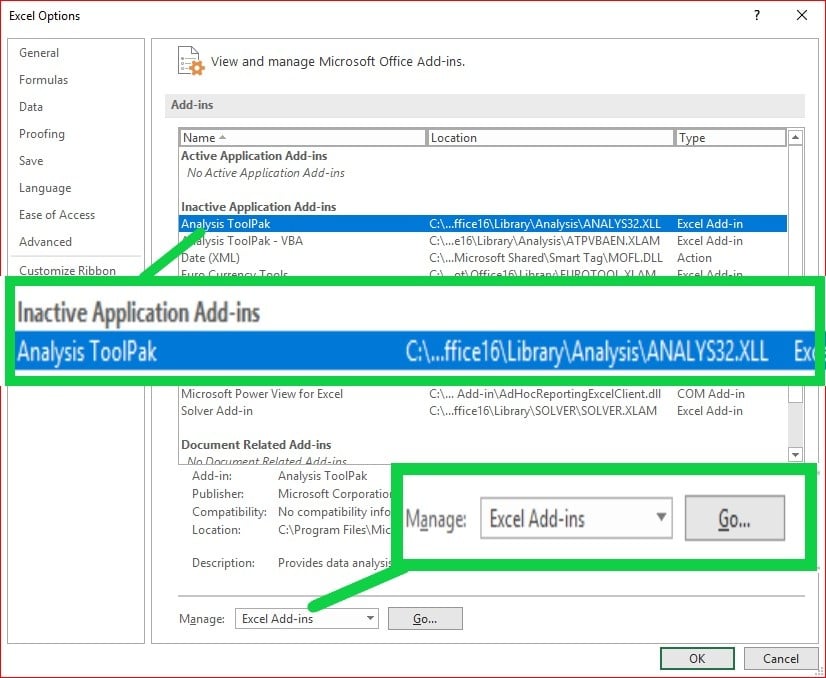
Go to → File → Option
In the popped up “Excel Options” dialog box,
Click “Add-ins” from the menu located left of the dialog box.
ow you can see all the add-ins currently available and the “Analysis ToolPak” add-in is listed under “Inactive Application Add-ins”.

Step 02
Select “Excel Add-ins” from the drop-down menu labeled “Manage”, which is located bottom of the “Excel Options” dialog box.
Then Click “Go”.
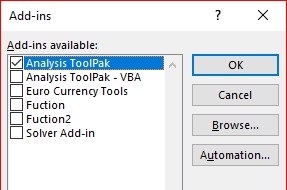
Now the “Add-ins” dialog box will be popped up. It has all the add-ins available listed with check boxes in front of them.
Step 03

Select the check box for “Analysis ToolPak”
Then click “OK”.
Now go to “Data” tab in the ribbon. If you have done everything right you should see the “Data Analysis” command under “Analysis” group.
We will discuss how you can analyze data using tools available in this add-in in next tutorials.
SHARE