Single variable data table in excel - Sensitivity Table with examples
SHARE
1. What is single variable data table
Microsoft Excel data table option supports single variable or double variable sensitivity analysis option. In this tutorial, we are going to learn how to use single or single variable data table in excel which is also called a one-way data table.
In single variable data table, we can have a set of outcomes with respect to the different values for a specific variable of a formula. We can get the results for any number of calculations with respect to different values for a single input cell in this type of data table.
2. Example for single variable data table - Loan payment calculation
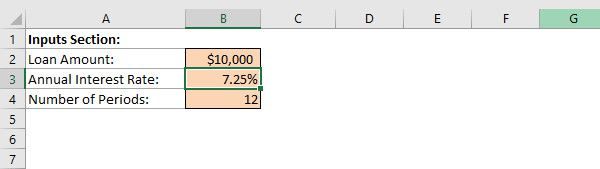
Let us consider a simple example of comparison of loan payment calculations with respect to different interest rates.Assume that you borrowed $10000.00 for a period of 24 months to be settled by 24 equal monthly payments.
Setup the excel worksheet as follows for input values.
Use Excel PMT () function to calculate loan payment
Microsoft Excel PMT function can be easily used to get total loan payment per period assuming equal payment and constant interest rate. Follow this tutorial to learn more on PMT function.
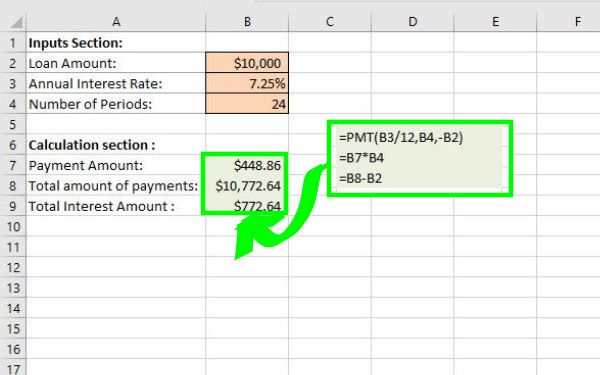
Let us now calculate the monthly due payment amount using PMT function and then we can calculate total amount of the payments and interest based on the monthly payment.
Select cell "B7” and type following formula.
= PMT(B3/12,B4,-B2)
Press enter.
You get the equal monthly payment amount for loan.
Next in the cell B8, Type the formula = B7*B4
That gives you the total amount of payments.
Now we need to get total amount of interest. This can be calculated from the difference between total amount of payments and the loan amount (principal)
In the cell "B9" ,Type the formula = B8 – B2
Now you have the basic calculations required to review the loan scheme.
3. Introduction to the Microsoft Excel Data Table
Data table tools comes under the Microsoft Excel What If Analysis tools. What if Analysis is the process of changing the values in specific cells to observe how that change affect the outcome of formulas within worksheet which are dependent on the changing variable.
Data tables can be used to get a set of outcomes for selected formulas for different values for a given variable or input cell values and present it within a cell range. This is more or less a table like format where the formulas and the set of values for changing variable or input cell are located in header column and header row.
Use single variable Data Table in Excel to evaluate the change of loan payments depending on different Interest rate
Now consider a situation where you need to compare the effect of change of interest rate on above calculations. Obviously you can change the cell input value for interest rate. But to do a comparison, you would have to remember or record the results of the calculations with respect to each change of the input cell value.
Instead of this time-consuming and error-prone manual method we can use Microsoft Excel data tables tool for this analysis. single variable data table option in excel can be used to present a set of results for multiple number of calculations with respect to different values for a specific input cell.
single variable data table can be either a row oriented data table or a column oriented data table. In row oriented data tables, the different values for the specified cell input are placed across a row of cell range whereas in column oriented data tables these different values for the specified variable are placed down a column of cell range.
Here we consider a row oriented single variable data table in excel.
05 Steps to setup single variable data table in excel easily
Step 01:
Type the different input values for variable in question in a row of cells adjacent to each other.
In this example the different interest rates which we are going to evaluate the loan payment details, are to be entered.
Step 02:
Now, enter the calculation formulas within the column just left to the first cell and one row below the cell range in which you have entered the different values for changing variable.
Instead of entering the full formulas again, you can simply link the formula by referring the cells which holds the required formulas.
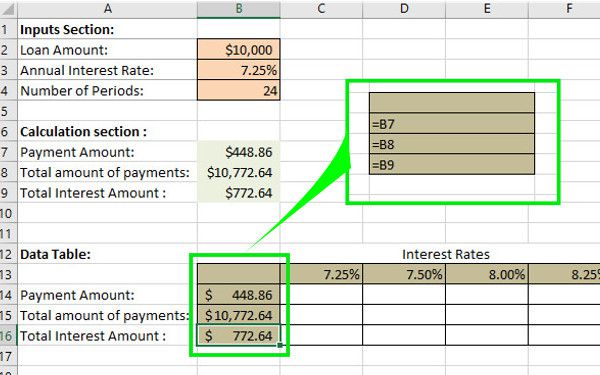
Step 03:
Select the whole cell range covering the different values for the changing variable and calculation formula column.
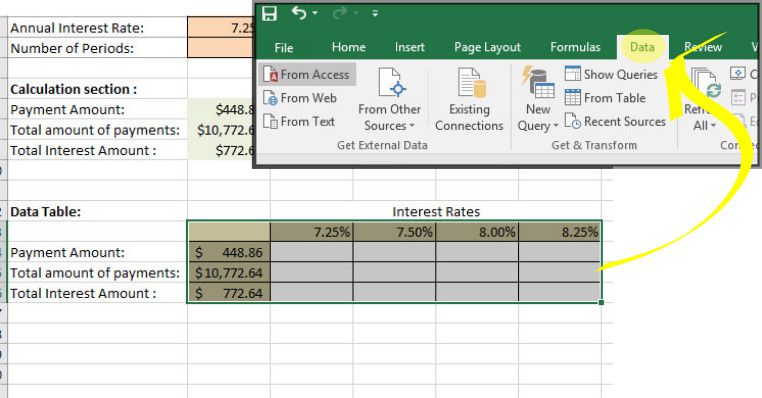
Step 04:
Go to “Data” tab → “Forecast” command group → Click “ What-if-analysis” → select “Data Table..” from the drop down menu.
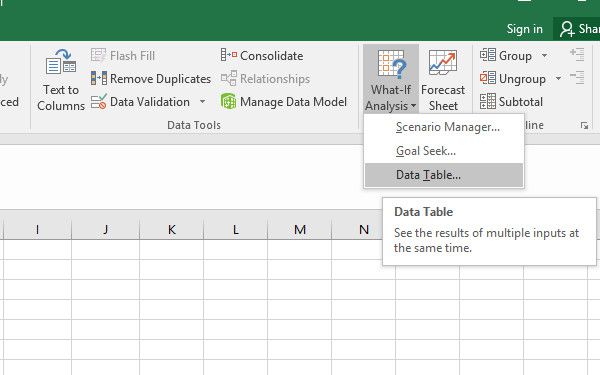
Now the “Data Table” dialog box appears. It has two inputs to be made,
- Row Input Cell
- Column input cell
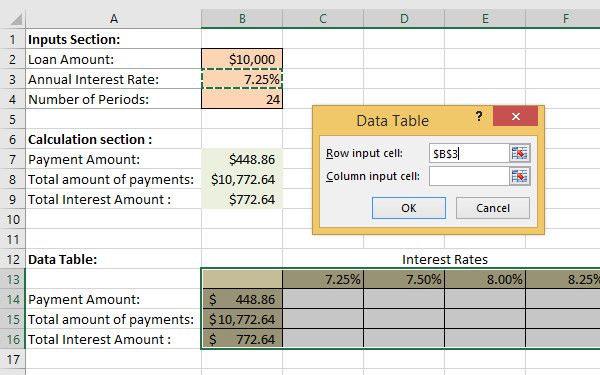
Values for the changing input cells are placed within a row of cells hence it is row oriented data table as we discussed earlier.
In this type of data table we only need to select the matching input cell for the “Row Input Cell” only and we will keep the Column Input Cell empty as this a single variable data table in excel.
Step 05
Place cursor in the “Row Input Cell” input box and select cell “B3” which is the cell reference for input cell for changing variable.
And then click “OK”
If you have interchanged the variable input values and the calculation formulas between column and row respectively, then you need to omit the “Row input cell” and enter the reference for input cell for variable in the “Column input cell” input box, because now it is column oriented data table.
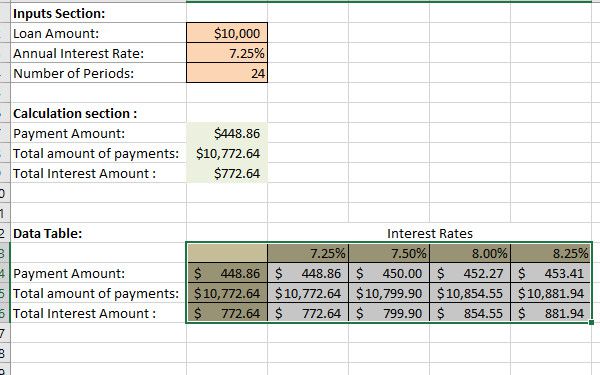
You Can see that the whole set of results with respect to different values of the interest rates are generated for each of the loan payment, total amount of payments, total amount of interest.
You can download our free example file single variable data table in excel down below!
This tutorial created using Microsoft Excel 2016. Other compatible versions are Excel for Office 365 Excel for Office 365 for Mac; Excel 2016; Excel 2019 for Mac; Excel 2013; Excel 2010; Excel 2007; Excel 2016 for Mac; Excel for Mac 2011. If you find any issues using Data Tables in those versions, please leave a comment below.
SHARE