What is Pivot Table feature in Excel ?
SHARE
Microsoft excel Pivot table is a very powerful feature, if not the most powerful feature available for data analyzing and summarizing. But it is also a least understood feature by the most.
I ask you to closely follow this tutorial series. Then, you will learn how easy to use the Pivot Table feature. May be you will feel bad for not using it earlier for your daily chores.
This is a feature comes with Microsoft Excel that can be used to filter, summarize, analysis and calculate data in a cell range or a table in a worksheet or other compatible data source.
Imagine that you have a spreadsheet full of data with so many columns and rows. And you cannot understand any meaningful information right away.
In that case, you could be able to generate a summarized table with lot of insights into the original data set with the use of this amazing feature.
Let see the following demonstration of how to use this feature.
The Data used for the demonstration
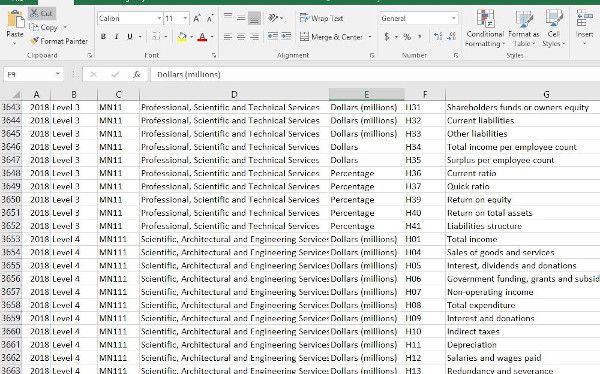
Here, we are considering a data set of annual enterprises survey done in New Zealand. It provides financial related data for various industries and sectors.

There are exactly 27810 rows in this data set. If you scroll down and across the worksheet you can see there are lot of important data in it. But, do you think it is possible to analysis and summarize this data using any common method? I bet you guys can do it. But I am sure it will be a boring task.
The Pivot Table
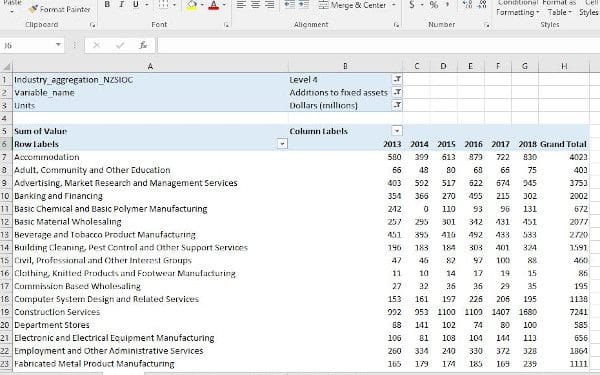
Following figure shows a pivot table generated from above data set.

I just needed less than 10 mouse clicks to build this Pivot Table. Would you believe it?
That is the power of Microsoft Excel Pivot Tables.
In next tutorial we will learn how to create a Pivot Table.
SHARE