Build your own soccer prediction application
SHARE
Predicting the outcome of a soccer match is extremely important for betting enthusiasts and of course for the betting companies. Betting companies use very sophisticated statistical and analytical models to set the odds for specific outcome.
You might have already noticed that favorite outcome has lowest odds while the unlikely outcomes have highest odds. If you are betting on soccer matches, I will guide you to build a soccer prediction application for yourself in Microsoft Excel.
The Everything Guide to Sports Betting: From Pro Football to College Basketball, Systems and Strategies for Winning Money is arguably the best book out there to learn the art of smart betting and make you a pro bettor. Veteran betting analyst Josh Appelbaum in his book says that no one becomes a sports betting expert overnight, it takes lot of time and effort to become a veteran. So bear with me in this guide that I will try to teach you one aspect of smart betting, which is using the statistical models.
If you just need the soccer prediction application, Go on, Just Download it.
Soccer Prediction models based on Poisson Probability Distribution
Out of many prediction models, Poisson probability distribution based models are simple yet very powerful when it comes to predictions. There are many research papers and articles that claims the validity of Poisson distribution based soccer prediction models, and you can find few examples if you search the internet.
Simply, we can use Poisson distribution to find out the probability of occurrences of an event a specific number of times; in our case the event being “scoring a goal”, hence we can find the probability of occurring “x” times the event “scoring a goal”.
It is required to calculate the Poisson parameter or mean value of poison distribution of the given random event which is the “Goal expectancy” of the team in this case.
Goal Expectancy (Gx) Calculations
Goal expectancy is the most important parameter we need in this soccer prediction model. Therefore we should be very careful when calculating this parameter. There are different types of methods and procedures to calculate goal expectancy.
The one I explain here has fairly high accuracy of predicting result of a soccer match. It uses past league statistics to calculate team’s average goals scored, team’s average goals conceded and league average goals for home or away team.
According to this article Poisson distribution soccer prediction model predicts the results close to accuracy of 60%, when it comes to sport betting.
If you feel like downloading the file before go any further,click the button below!
Building the Soccer Prediction Application
First of all you should have acquired a proper reliable past data set. Every prediction depends on the data set. In this tutorial we are going to build a soccer prediction application for England Premier League Season 2020/2021. We will use the England premier league season 2019/2020 final table as our data set.
Step 01: Acquiring and preparing data
Before preparing your data set, you should have clear knowledge of selected competition structure or league system. There are hundreds of soccer leagues out there and each one of them could be different to each other to some extent. You would need to understand how many teams are playing in the tournament, how many games playing with each team,are there any possible promotion or relegation systems. Those are the main factors you should know at the very beginning.Then only you can build a proper soccer prediction app.
Coming in to the England Premier leagues 20 teams participate in the league, and each team play one game with every team in the league in their home ground (Home match) ,one game with every team at opponent’s home ground(Away match).
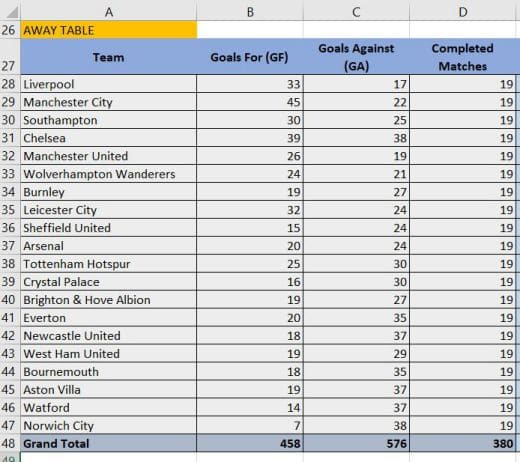
We have to prepare two data tables;one for home matches and one for away matches.
Home table contains data for each team’s home ground performances and Away table contains the data for each team’s away performances.
In the data table;
- Goals For (GF) column contains the total goals scored by a given team.
- Goals Against (GA) Column contains the total goals conceded by each team.
Completed matches column contains the number of matches played at home or away ground.
having brief understanding of league system and the model ,
- Open a New Excel Workbook
- In the excel sheet prepare the “HOME TABLE” and “AWAY TABLE” as shown below.
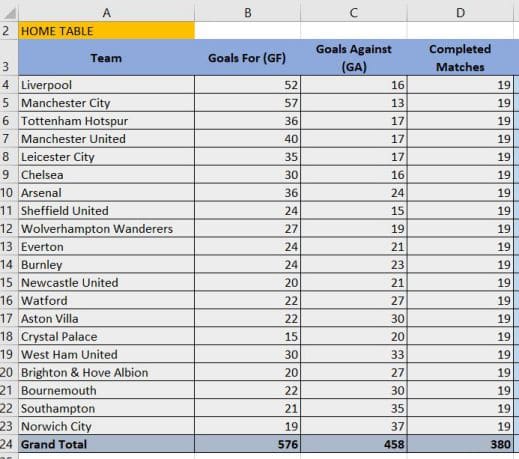
Grand Total Row contains the summation of the values in each respective column.
- Use Excel Formula “=SUM ( ) to calculate the Grand Totals for each column.
e.g.: Calculate the total “Goals For” in the HOME TABLE.
Select cell “B24” → Type “=SUM (“ → Select the cell range “A4:A24” → Press “Enter” key
Step 02: Calculate the Average Goals Scored by each team for home and away matches
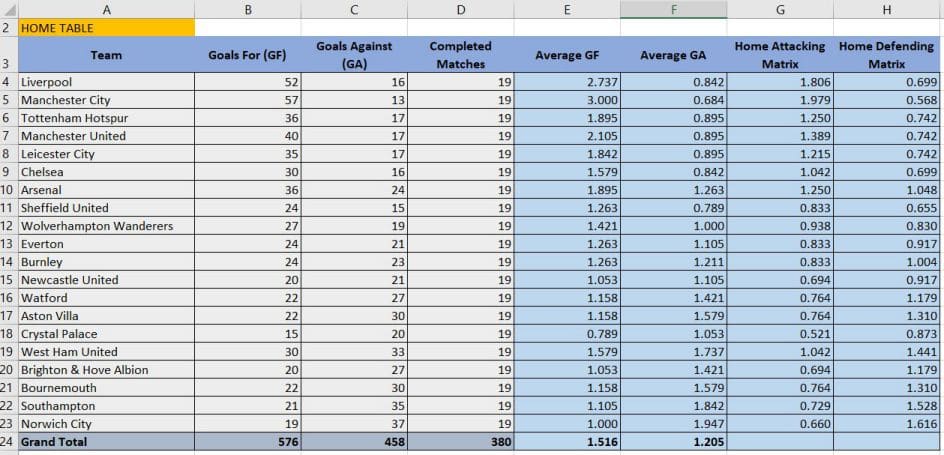
In this step of building soccer prediction app, we calculate average goals scored by each team for both home and away table.
What we have to do is simply divide the “Goals for (GF)” column value by number of completed matches.
To calculate the “Average GF” of “Liverpool” type “=B4/D4” in the cell “E4” and press “Enter” key. Copy the formula by dragging fill handle up to “E24”
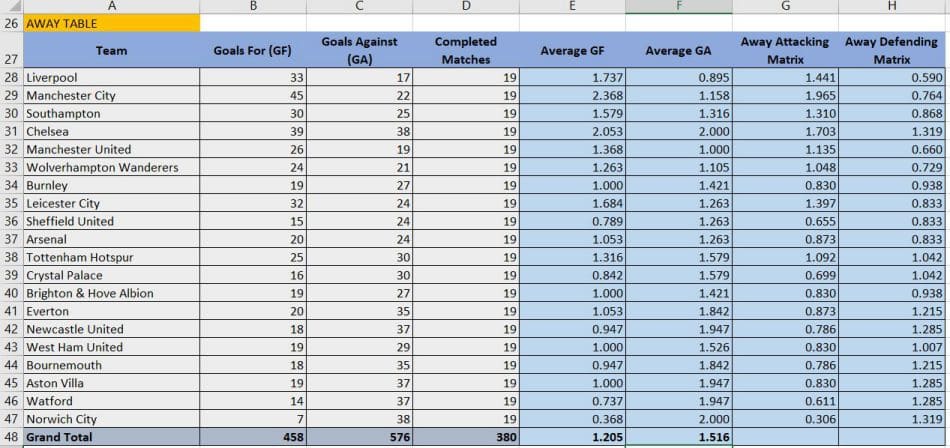
Repeat the same procedure to calculate the “average GF” for “AWAY TABLE”
Step 03: Calculate the Average Goals Conceded by each team for home and away matches
We divide the “Goals Against (GA)” column value by number of completed matches to get the “Average GA” value.
To calculate the “Average GF” of “Liverpool” type “=C4/D4” in the cell “F4” copy the formula by dragging fill handle up to “F24”
Repeat the same procedure to calculate the “average GA” for “AWAY TABLE”
Step 04: Calculate the Attacking matrix and defending matrix
Attacking matrix and defending matrix represent the attacking and defensive strength of each team. Those are basically the primary parameters needed for soccer prediction application.
Dividing team’s “Average GF” by “League Average GF” gives the attacking matrix and dividing team’s “Average GA” by “League Average GA” gives the defending matrix.
For HOME TABLE, type “=E4/$E$24” within the cell “G4” to calculate attacking matrix and type “=F4/$F$24” within cell “H4” to calculate defensive matrix. Then Select “G4:H4” and copy the formula up to “G23:H23” by dragging the fill handle.
You can repeat same procedure to calculate attacking and defensive matrix for “AWAY TABLE” also.
Finally your HOME TABLE and AWAY TABLE in your soccer prediction app should look like this.
Now that we have calculated all the parameters required to calculate goals expectancy for each team, we move into next step. Here we calculate the goal expectancy of given pair of teams and to find probability and odds for a given result.
Step 05: Calculate goal expectancy (Gx) parameters for given pair of teams.
It is better to add new excel sheet to your workbook and prepare the input section as shown in the below figure.
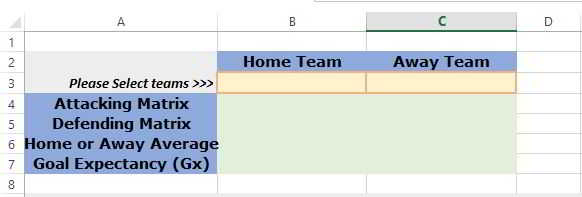
We are going to add a drop down menu containing the list of teams playing in the league into “B3” and “C3” cells.
Select the range “B3:C3” → Goto “Data” tab → “Data tools” command group →click “Data Validation” button → Select “List” from “Allow” drop down → Select the range of cells containing Teams list within “Source” input box.
If you like to know more about Excel Drop Down Menus read this tutorial.
Depending on the team selection we need to input matching attacking matrix, defending matrix and Home or Away average in the above table.
We are going automate the activity by using Excel’s INDEX and MATCH functions.
We are going to import parameter values from the sheet where we input HOME TABLE and AWAY TABLE data.
For ease of use I have rename the worksheet with data as “Data Sheet” and the current worksheet where we are working now renamed to “Dashboard”.
For the following formulas I have referred those renamed sheet names.
Following are the formulas inserted in the respective cells;
B4: =INDEX('Data Sheet'!G4:G23, MATCH(Dashboard!B3, 'Data Sheet'!A4:A23,0))
C4: =INDEX('Data Sheet'!G28:G47, MATCH(Dashboard!C3, 'Data Sheet'!A28:A47,0))
B5 : =INDEX('Data Sheet'!H4:H23, MATCH(Dashboard!B3, 'Data Sheet'!A4:A23,0))
C5 : =INDEX('Data Sheet'!H28:H47, MATCH(Dashboard!C3, 'Data Sheet'!A28:A47,0))
B6 : ='Data Sheet'!E24
C6 : ='Data Sheet'!F24
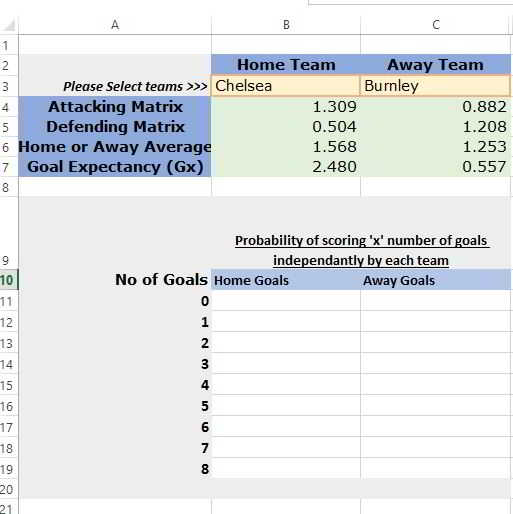
Calculate the goal expectancy
Goal Expectancy of Home Team = Home Team Attacking Matrix X Away Team Defensive Matrix X Home Average Goals
Goal Expectancy of Away Team = Away Team Attacking Matrix X Home Team Defensive Matrix X Away Average Goals
Step 06: Calculate probability of scoring given number of goals by home team or away
The next step of the soccer prediction app is calculating the probability of scoring given number of goals by a team.
For that we use Poisson distribution function given in the Microsoft Excel.
Function Structure:
=POISSON.DIST(x, mean, cumulative)
x : Here we should provide the number of goals in consideration
mean : goal expectancy of the team
cumulative : false
In this model for soccer prediction we will find the probabilities for scoring zero to eight goals by each teams. You better prepare a table shown as below to carry out the calculations
Then insert the POISSON distribution formula within cell “B11” as “=POISSON.DIST(A11,$B$7,FALSE) ” and within cell “C11” as “=POISSON.DIST(A11,$C$7,FALSE) “.
Then select the cell range “B11:C11” and copy the formula up to “B19:C19” by dragging the fill handle.
Change Cell range number formatting to percentage if you prefer to show probabilities in percentage instead of decimals.
You could also set “Color Scale” type of Conditional formatting to visualize the high and low probabilities.
Step 07: Calculate the probability and betting odds of given match results
Now that we have independent probabilities for scoring a given number goals by home team or away we can combine these them to find out the probability of occurring any given result of a match played between those two teams.
For the next step add another table to your worksheet as shown below.
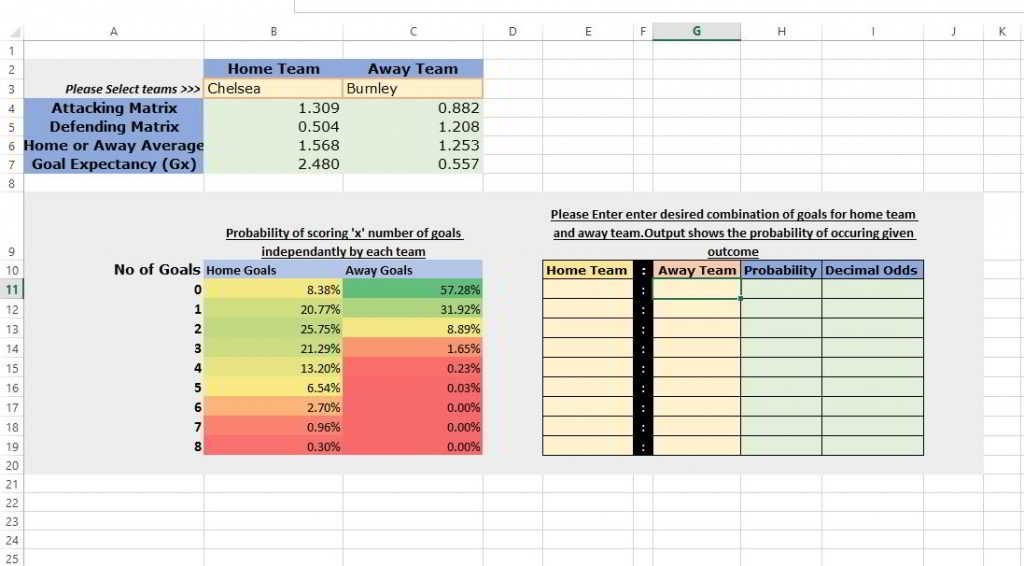
At the end we will input possible goal combinations for the match in the “Home Team” column and “Away Team” column. Then the it will show us the probability of occurring that result and respective decimal odds. Same as earlier, we will use INDEX ( ) and MATCH ( ) formulas to get the matching probability for home goals and away goals from probability table we just created above. In the cell “H11” which the first row in Probability column type the below formula;
=INDEX(B$11:B$19, MATCH(E11,A$11:A$19,0))* INDEX(C$11:C$19, MATCH(G11,A$11:A$19,0))
Then copy up to “H19” by dragging the fill handle. Better to change the number formatting of the Probability column also to percentage. To convert the probability to decimal odds we get the ‘inverse” of the probability value.Step 08: Swapping Relegated teams with promoted teams
Since three teams from the previous season relegated from the league and another three teams promoted to the 2020/2021 league we have to swap the promoted teams for relegated teams.
Bournemouth, Watford and Norwich City are the teams relegated from the league where Leeds United, West Bromwich Albion and Fulham are the teams promoted from England Champions League to the Premier League. Based on the their previous season table position following swaps are carried out.
Leeds United in for Bournemouth
West Bromwich Albion in for Watford
Fulham in for Norwich City
Final Soccer Prediction App Should Look like this
Disclaimer:
The soccer predictions calculated on this model are designed to project the outcome of future games. These predictions are a great baseline to use when looking at games to bet, but should only be used as one piece of the puzzle. There are many other factors that go into final outcome of a game, so research well and carefully before taking your finally decision.
SHARE